
In the world of remote sensing, NDVI is one of the most important and widely used indices. NDVI, or Normalized Difference Vegetation Index, is a numerical indicator that is used to assess vegetation health and density. NDVI is calculated using the visible and near-infrared bands of light that are captured by remote sensing instruments.
NDVI has become an essential tool for agricultural monitoring, land-use mapping, and natural resource management. It is used to estimate plant growth, vegetation cover, and the amount of chlorophyll in leaves. In this article, we will explore What is NDVI in remote sensing?
What is NDVI In Remote Sensing?
The Normalized Difference Vegetation Index (NDVI) is a widely used remote sensing technique to assess the presence, health, and density of vegetation on Earth’s surface. It provides a numerical value that represents the relative greenness of an area, which can be used to monitor vegetation growth, drought conditions, and land use change over time.
NDVI measures the difference between the amount of light reflected by vegetation in the near-infrared (NIR) and visible (VIS) portions of the electromagnetic spectrum.
NDVI is calculated using the following formula:
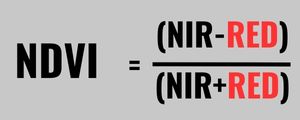
In this equation, NIR represents the near-infrared light reflected by vegetation, while Red represents the visible red light. Healthy vegetation typically absorbs more red light for photosynthesis and reflects more near-infrared light, resulting in a higher NDVI value. Conversely, sparse or stressed vegetation reflects more red light and less near-infrared light, leading to lower NDVI values.
NDVI values range from -1 to 1, where negative values indicate water bodies or clouds, values close to zero represent barren land or urban areas, and positive values (from 0.1 to 0.9) indicate the presence of vegetation. The higher the NDVI value, the denser and healthier the vegetation is.
When Was NDVI Created?
The concept of the Normalized Difference Vegetation Index (NDVI) was developed in the early 1970s by Texas A&M University. Their work was built upon earlier research on using remote sensing techniques to study vegetation.
The first major application of NDVI came in 1979 when NASA’s Landsat satellite series started collecting and providing multispectral imagery data, which allowed researchers to calculate NDVI values on a large scale.
Since then, NDVI has become a widely used tool in remote sensing for monitoring vegetation health and land cover changes globally.
What Is The Formula For NDVI?
The formula for calculating the Normalized Difference Vegetation Index (NDVI) is as follows:
NDVI = (NIR – Red) / (NIR + Red)
In this equation, NIR represents the near-infrared light reflected by vegetation, and Red represents the visible red light. By comparing the difference between these two values relative to their sum, NDVI provides a measure of the vegetation’s health and density.
How Is NDVI Used In Remote Sensing?
NDVI (Normalized Difference Vegetation Index) is a crucial tool in remote sensing for monitoring and assessing vegetation health, density, and distribution across the Earth’s surface. It is derived from satellite-based multispectral imagery, which captures the reflectance of light in different wavelengths, including visible red light and near-infrared light.
Here are some ways NDVI is used in remote sensing:
1. Vegetation Health Monitoring
NDVI helps in determining the health of vegetation by analyzing the differences in reflectance between the red and near-infrared bands. Healthy vegetation absorbs more red light for photosynthesis and reflects more near-infrared light, resulting in higher NDVI values. Stressed or sparse vegetation has lower NDVI values.
2. Agricultural Management
NDVI is used to monitor crop growth, estimate crop yields, and identify areas that require irrigation, fertilization, or pest management. By analyzing NDVI values over time, farmers and agricultural managers can make informed decisions to optimize crop production and resource allocation.
3. Drought And Desertification Assessment
NDVI helps in identifying areas affected by drought, as stressed vegetation exhibits lower NDVI values. Monitoring NDVI changes over time can reveal the severity and progression of drought conditions, enabling governments and organizations to implement water management and conservation strategies.
4. Land Cover And Land Use Change Detection
Analyzing NDVI data over time can reveal patterns of deforestation, reforestation, and urbanization. This information is valuable for understanding the impact of human activities on ecosystems, planning land use, and implementing environmental conservation measures.
5. Climate Studies
NDVI data contributes to the study of climate change, as it can help detect changes in vegetation phenology, such as the timing of leaf emergence and senescence. These changes can be linked to variations in temperature, precipitation, and other climate factors.
6. Disaster Response
In the aftermath of natural disasters, such as floods or wildfires, NDVI can be used to assess the extent of damage to vegetation and monitor recovery progress over time. This information can inform disaster response and recovery efforts, including reforestation and habitat restoration projects.
READ MORE: Importance of Remote Sensing in Agriculture
Conclusion: What Is NDVI In Remote Sensing?
NDVI is a powerful tool for assessing vegetation health and density in remote sensing. It is used to monitor plant growth, crop yields, and environmental factors that impact vegetation.
NDVI is particularly useful for detecting changes in vegetation over time, making it an essential tool for natural resource management, land-use mapping, and agricultural monitoring.
FAQs:
What is NDVI and how is it used?
NDVI (Normalized Difference Vegetation Index) is a measure of the photosynthetic activity of plants. It is calculated from the reflectance of visible and near-infrared light from the Earth’s surface. NDVI is used in various fields such as agriculture, ecology, forestry, and environmental studies to monitor vegetation health and assess land use changes.
What is NDVI used for in GIS?
In Geographic Information Systems (GIS), NDVI is used to map and analyze vegetation patterns and changes over time. NDVI imagery can be combined with other spatial data to generate insights and make informed decisions related to land use management, crop health, and ecosystem health.
What is a good NDVI value?
A good NDVI value varies depending on the application and the type of vegetation being monitored. Generally, NDVI values range from -1 to 1, where values closer to 1 indicate healthy and dense vegetation, while values closer to -1 indicate little or no vegetation. A threshold of 0.2 to 0.3 is often used to distinguish healthy vegetation from other land cover types.
Which satellite is used for NDVI?
Several satellites are used to collect NDVI data, including MODIS (Moderate Resolution Imaging Spectroradiometer), Landsat, and Sentinel-2. MODIS is particularly useful for large-scale vegetation monitoring due to its daily coverage and high temporal resolution, while Landsat and Sentinel-2 provide higher spatial resolution imagery for more detailed analyses.